DANGLE

Python is required to be installed and Python 2.4 is the distribution used in DANGLE. The graphical display also needs the Python Tcl/Tk libraries (Tkinter).
There are two ways to obtain the software:
Feel free to drop us an email if you have any questions about the software.
The stand-alone release of DANGLE (version 1.1.1) can be downloaded from the DANGLE SourgeForge download page.
Download and unpack the DANGLE tar file. It will create a dangle directory. All python programs are inside the src and gui directory. The DANGLE source codes are in the src directory, whereas the gui directory contains auxiliary scripts for graphical display of the predictions.
1. Make DANGLE
predictions (dangle/src/dangle.py)
2. Examine DANGLE predictions (dangle_gui/displayGLE.py)
3. Use your own parameter files
Main program: dangle/src/dangle.py
All you need to do is to execute dangle.py which is in the src directory. To run DANGLE, type at the command line (you don't need to be in the src directory to execute DANGLE):
python dangle.py inputFile [-dir path] [-reject x] [-cns] [-angleOnly] [-ppm]
Optional arguments:
| -dir path | Set the output directory to path. If no output directory is given, DANGLE by default creates a new folder named DanglePred. |
| -reject x | Avoid making predictions for GLE diagrams that contain more than x islands. By default, predictions are made for every GLE diagram. |
| -cns | Write a CNS/ARIA format output file containing dihedral angle restraints based on the predictions. |
| -angleOnly | Produce only the DANGLE prediction file; no GLE diagrams will be output. |
| -ppm | Write GLE diagrams in coloured PPM format, instead of the default grayscale PGM format. |
After the execution is completed, a specified output directory or the default DanglePred directory will be created containing all the prediction outputs.
Main program: dangle_gui/displayGLE.py
In the gui directory, there is a displayGLE.py program to generate a simple browser to allow prediction inspection. It takes the prediction table (danglePred.txt) as an argument. All GLE diagrams have to be in the same directory as the prediction table.
To execute the graphical display, type at a the command line (again you don't need to be in the gui directory to make this work):
python displayGLE.py DanglePred/danglePred.txt
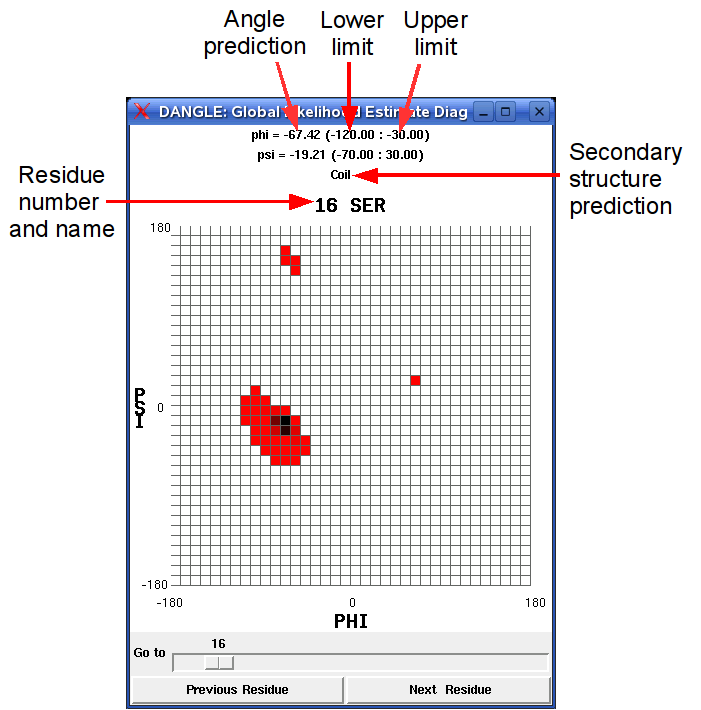
The predicted angles, the upper and lower limits, and the secondary structure assignment are shown on top of the GLE plot. Here is a snapshot:

If you do not want to use displayGLE.py, you can still convert PGM into PPM file using the script pgm2ppm.py (download here), which takes a file containing the names of PGM files (one file name per row) as an argument and creates corresponding PPM files.
python pgm2ppm.py FILE
In the dangle directory there is a config file. DANGLE looks for the parameter files specified in the config file. You can modify it, but all parameter files must be put in the parent directory of the python codes. (i.e. If dangle.py is in .../dangle/src/, then the parameter files have to be in .../dangle/.)
Alternatively, you can modify the parameter files directly. But please be aware that you will need to keep the right formats.
Here are the description of some files you might want to modify:
| homology.tab | The homology score used for sequence similarity comparison |
| angle_pop_XXX.txt | Probability of observing a particular angle for the residue type XXX, where XXX = GEN/GLY/PRO/PRE |
| referenceRandomCoilShifts.tab | Random coil values for each nucleus of 20 common amino acids |
| randomCoilShiftCorrections.tab | Position- and residue-specific correction factors for random coil shifts |
TBA
Copyright (C) 2009 Nicole Cheung, Tim Stevens, Bill Broadhurst (University of Cambridge)